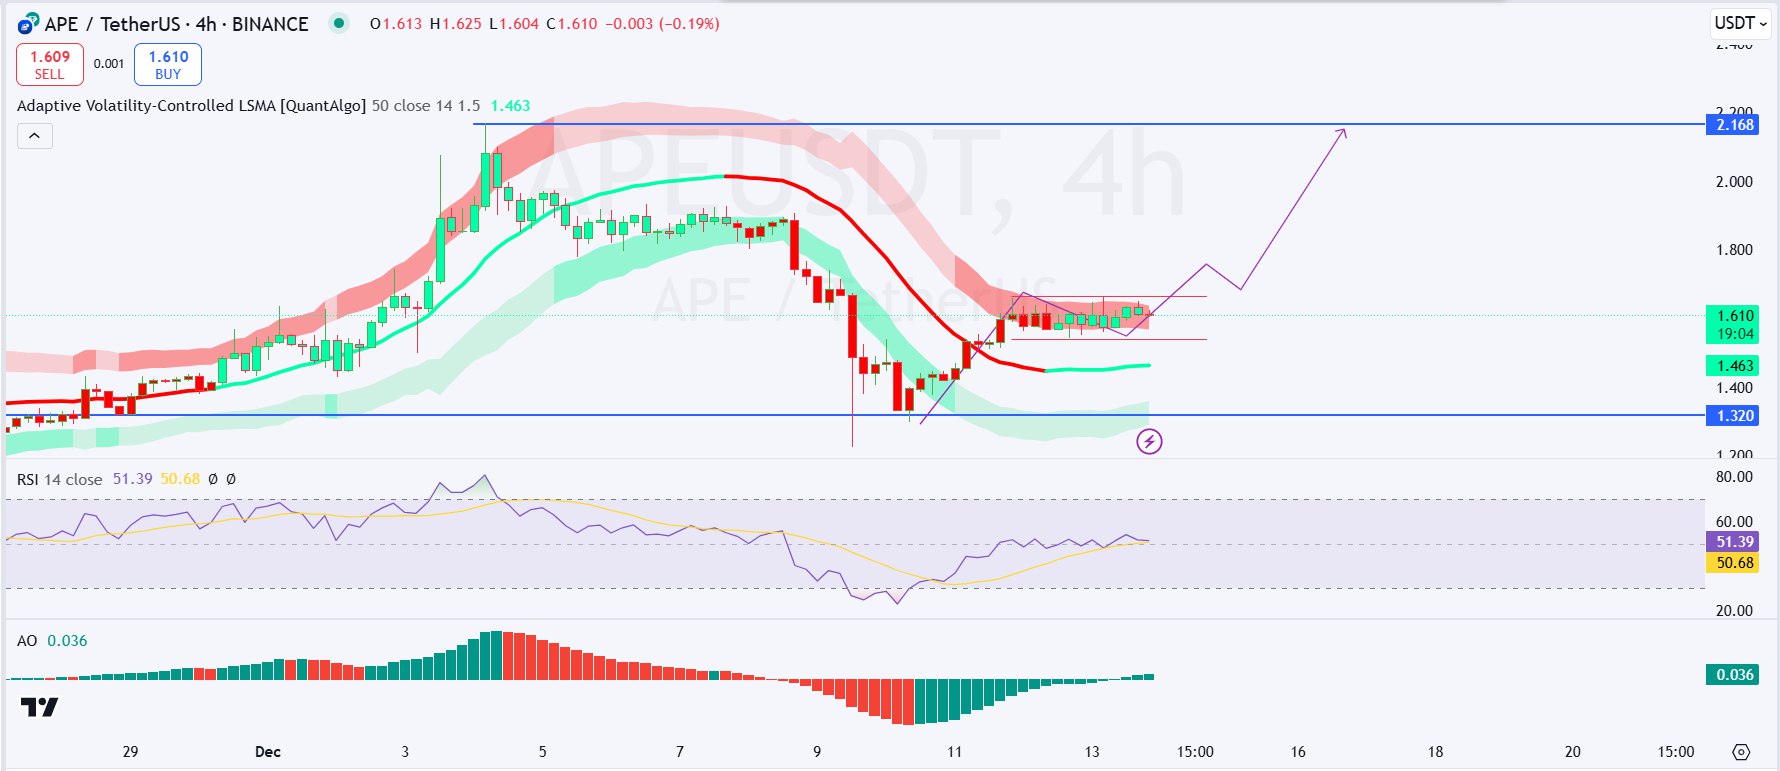
- Bull flag pattern pointed to breakout towards altcoin’s $2.168 resistance
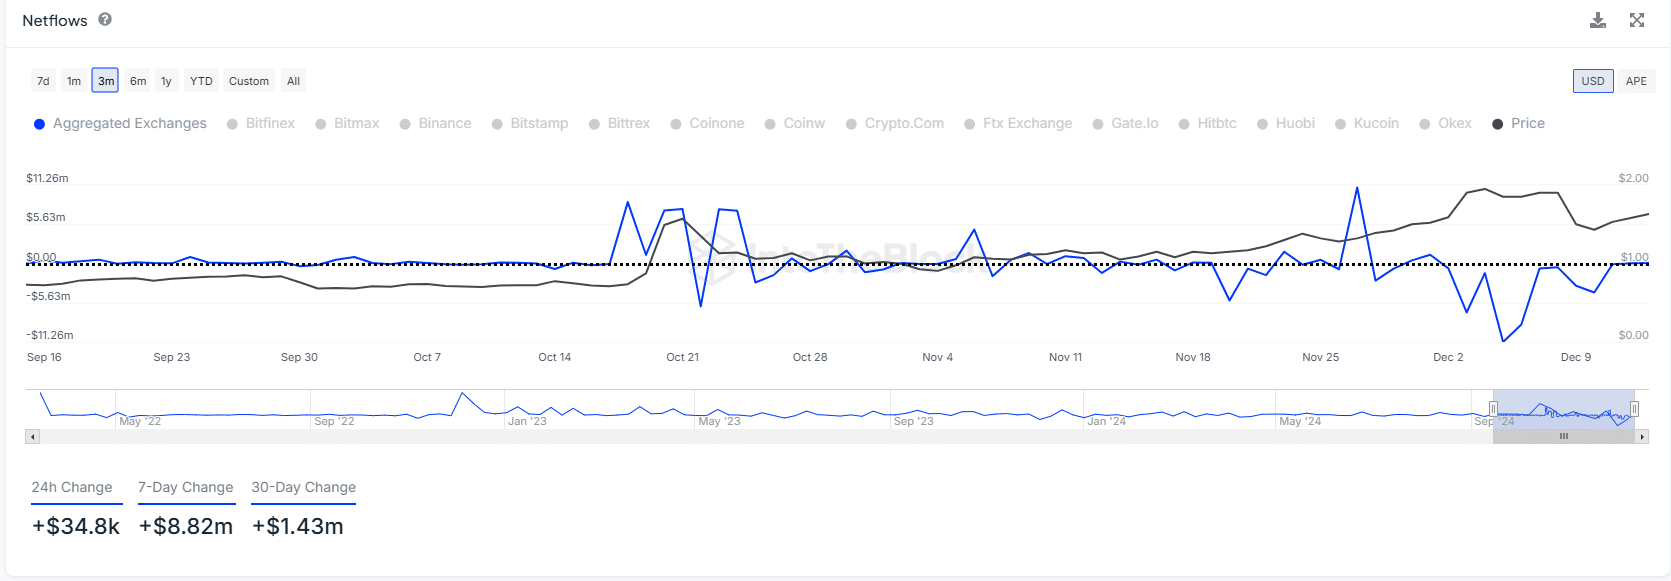
- At press time, netflows revealed a positive change of +$34.8k in just 24 hours
ApeCoin has shown promising signs of growth recently, fueled by a hike in market activity and bullish technical indicators. In fact, the altcoin’s price rose by 3.24% in 24 hours to trade at $1.61, at the time of writing.
On the metrics front, a surge in large transaction volumes and positive netflows indicated strengthening market sentiment. On the other hand, a bull flag pattern on the charts alluded to a breakout towards higher resistance levels.
As a result, many ApeCoin traders are now anticipating a hike in the altcoin’s value in the near term.
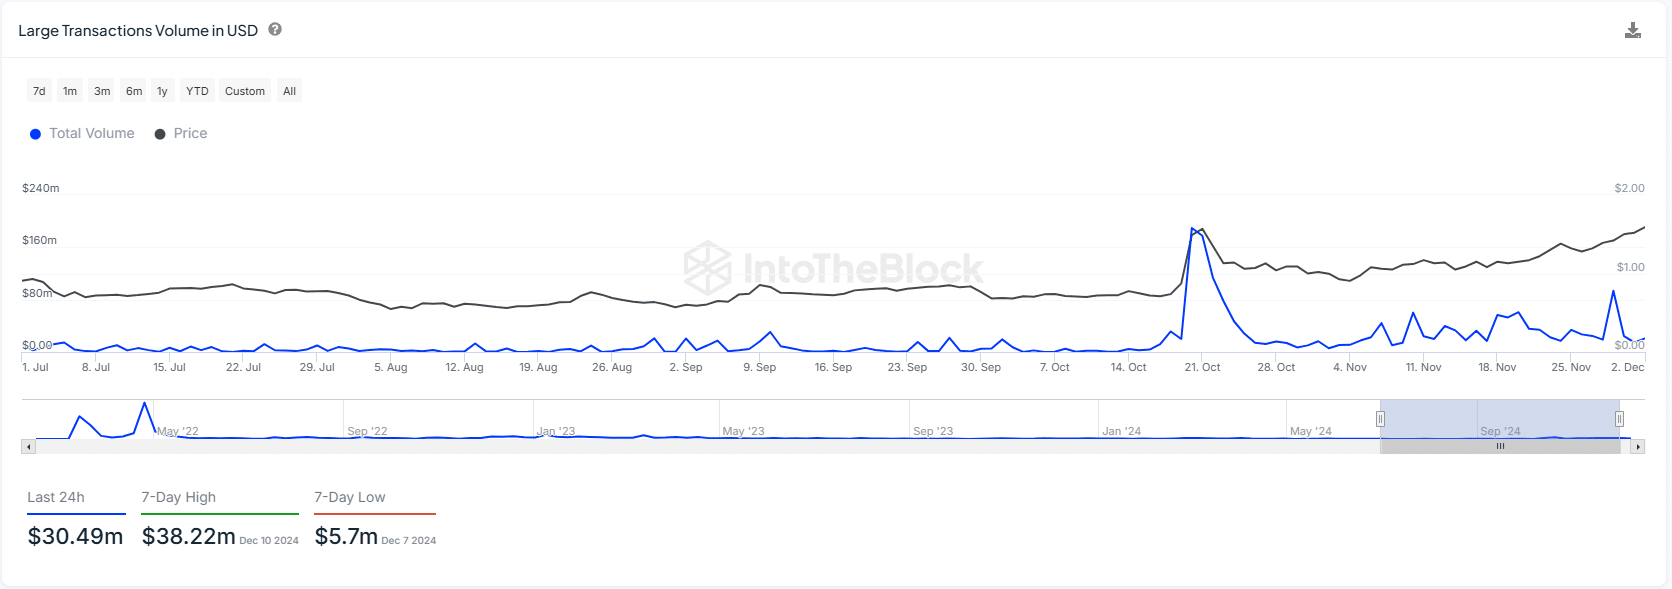
Large transaction volume continues to surge
ApeCoin’s recent performance has been marked by large transaction volumes, signaling strong investor interest. In the last 24 hours alone, large transactions amounted to $30.49 million, with a peak of $38.22 million on 10 December.


Source: IntoTheBlock
Over the last few months, the token has consistently attracted large trades, showing greater attention from institutional and high-volume investors.
This growing market interest has likely contributed to the steady hike in ApeCoin’s price, especially in late October and early December.
ApeCoin netflows underline growing confidence
The uptick in ApeCoin’s netflows further emphasized the growing confidence in the token. Over the aforementioned period, netflows saw a positive change of +$34.8k, with a significant hike of +$8.82 million over the past week.
These movements are a sign of greater demand for the altcoin, especially as more investors are now moving funds into ApeCoin.


Source: IntoTheBlock
The larger trend over the past month revealed netflows totaling +$1.43 million – A figure which strongly aligns with the price hike, reinforcing the optimistic outlook for ApeCoin.
Bull Flag pattern points to breakout
At the time of writing, technical indicators were also signaling a bullish outlook for ApeCoin. For instance, the 4-hour chart highlighted a classic bull flag pattern, one showing that a breakout may occur. The flagpole is followed by a period of consolidation, where the price stabilizes before breaking above key resistance levels.
The Adaptive Volatility-Controlled LSMA at $1.463 has been acting as a dynamic support zone, keeping the structure intact for a breakout.
If ApeCoin breaks above $1.66, this would confirm the continuation of the uptrend.


Source: Tradingview
The Relative Strength Index (RSI) stood at 51.39, showing neutral momentum with no signs of overbought or oversold conditions, leaving room for more gains. Additionally, the Awesome Oscillator (AO) flashed green bars – A sign of mild positive momentum.
If this pattern holds, the price could climb towards the $2.168 resistance level. However, a breakdown below $1.54 could signal a bearish reversal to the $1.32 major support level.
Long/Short ratio’s analysis
An analysis of the long/short ratio for ApeCoin also supported the case for an upward move. The ratio recently rose to 1.10, indicating that long positions have been outweighing short positions.


Source: Coinglass
This shift in sentiment is a sign of growing bullish confidence in ApeCoin’s short-term prospects.
While the market sentiment remains fluid, a higher long-to-short ratio indicates strong buying interest. This could push ApeCoin’s price higher if the trend sustains itself.
Source: https://ambcrypto.com/traders-apecoins-bull-flag-pattern-is-likely-to-play-out-this-way/


Leave a Comment