Injective (INJ) price has been on a tear, up 30% over the past seven days and surging 14% in the last 24 hours. Its trading volume has skyrocketed by over 250% in the same period, reaching $274 million.
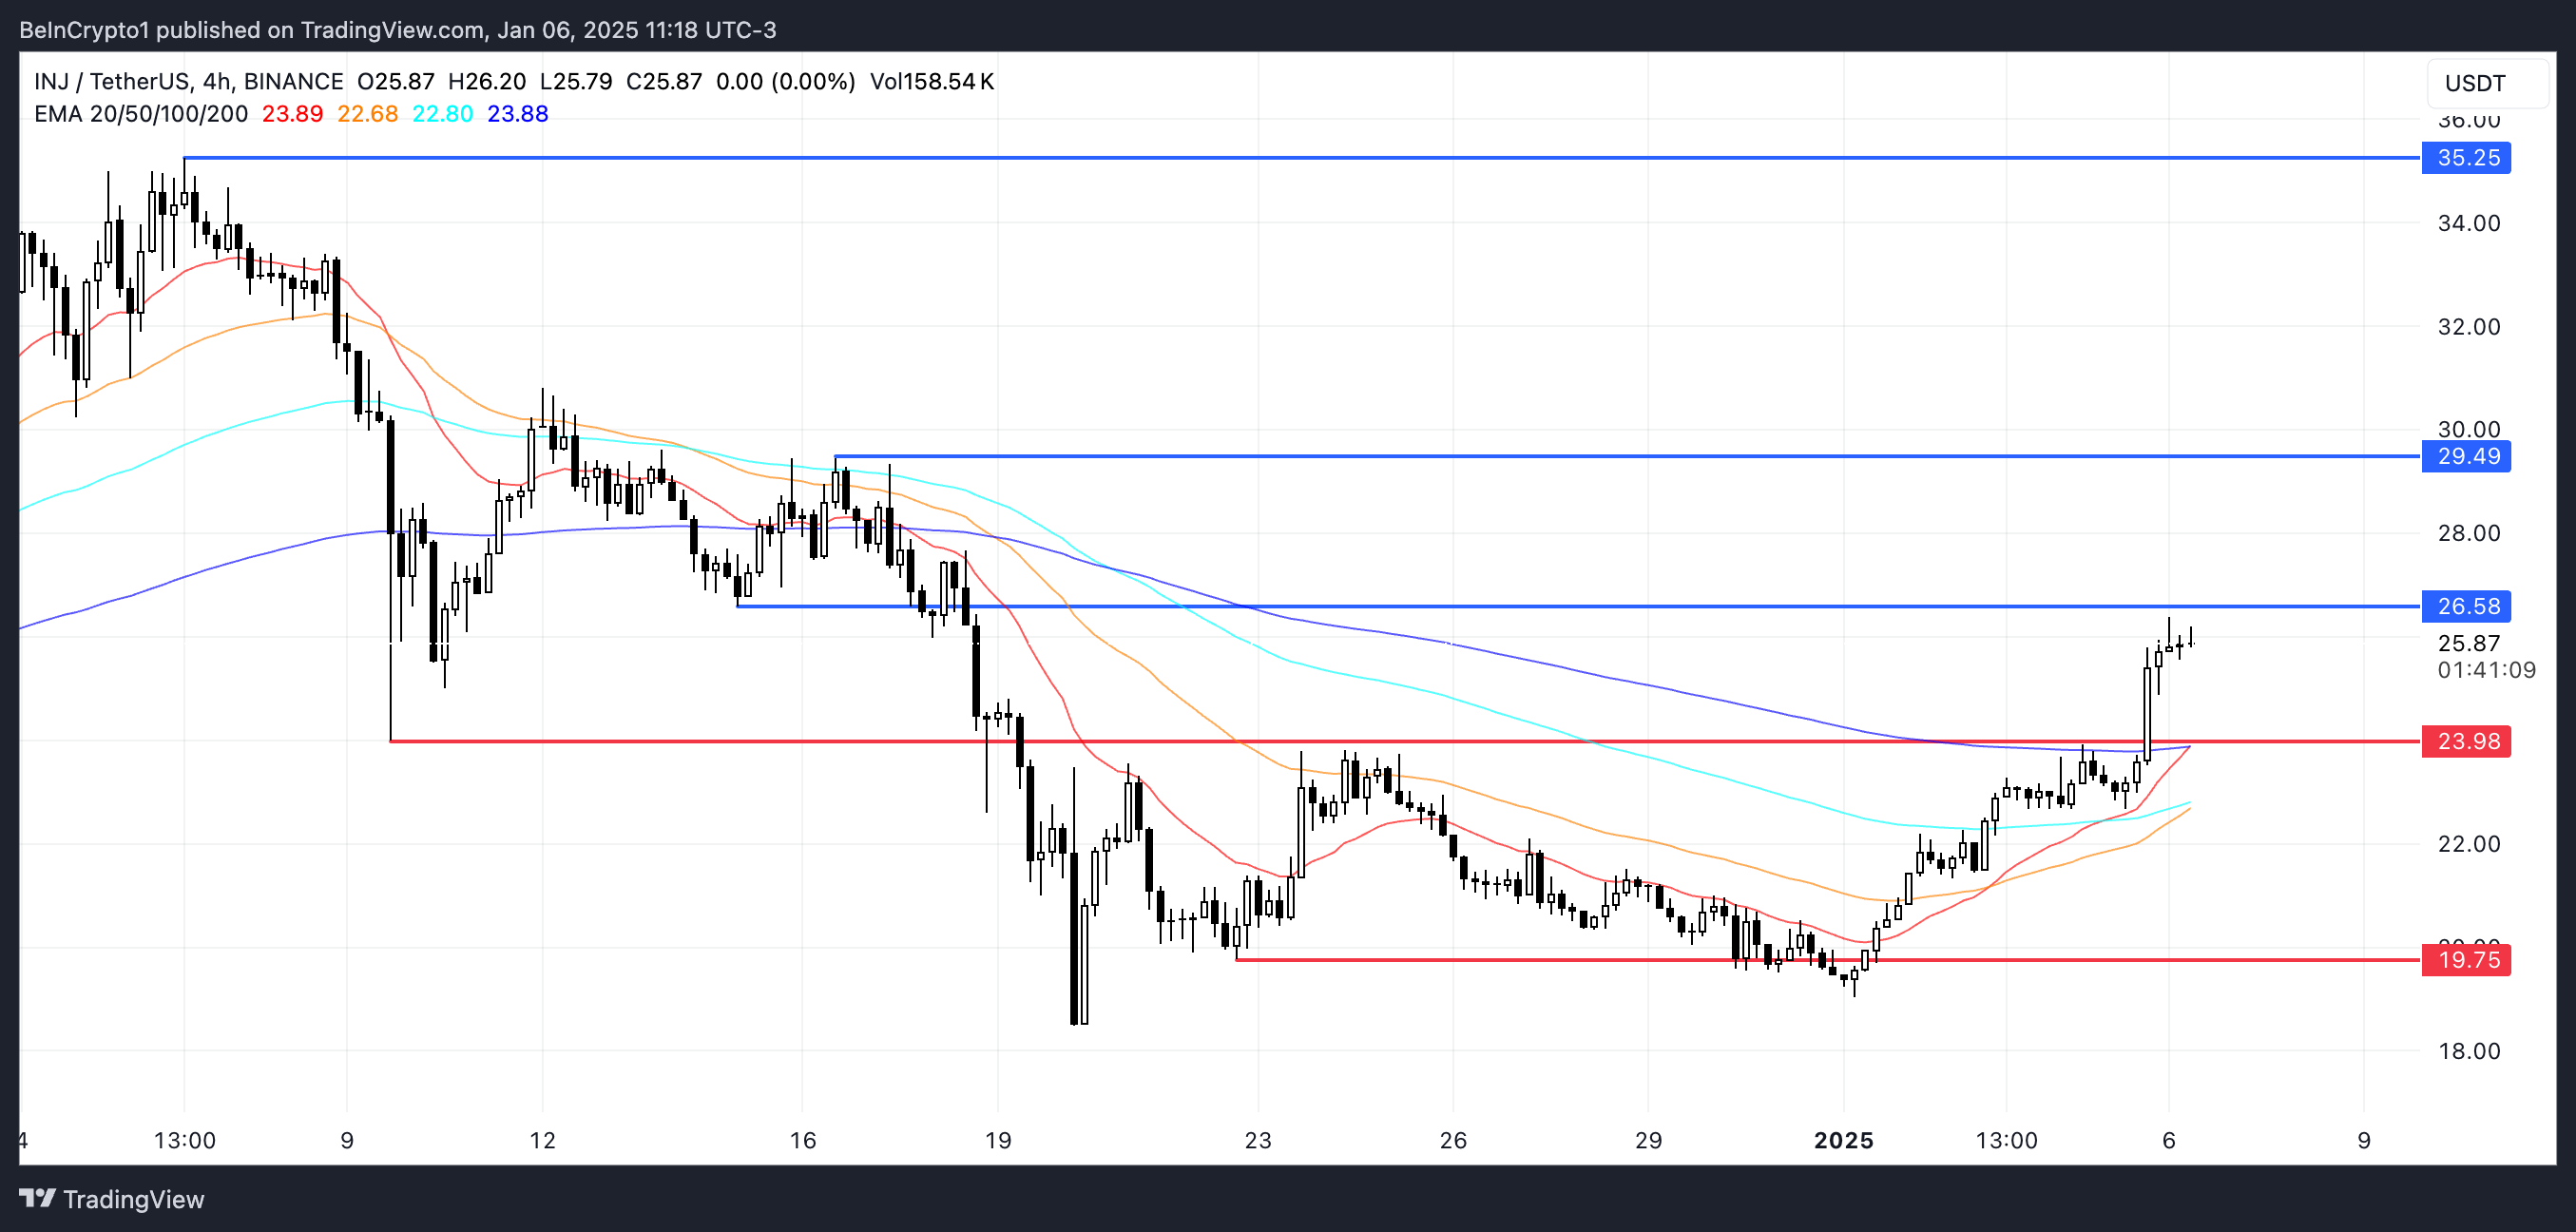
This strong price performance is supported by bullish technical indicators, including an overbought RSI at 80.6 and a BBTrend at its highest levels since November 2024. If the golden cross materializes, INJ could see further gains, targeting $26.5, $29.4, and potentially $35.2, but downside risks remain if support levels fail to hold.
INJ RSI Is Currently In The Overbought Zone
Injective Relative Strength Index (RSI) has seen a sharp increase, now sitting at 80.6, up from 61 just one day ago and 36 a week ago when its price began its recent surge. The RSI is a momentum indicator that measures the speed and magnitude of price movements on a scale from 0 to 100, providing insight into whether an asset is overbought or oversold.
Readings above 70 typically signal overbought conditions, suggesting that a pullback or consolidation might be imminent, while readings below 30 indicate oversold conditions, often hinting at a potential price rebound.

At its current level of 80.6, INJ RSI suggests that the asset is deep in overbought territory, reflecting strong bullish momentum driven by aggressive buying.
While this indicates high market enthusiasm and potential for short-term gains, it also raises caution for a possible cooldown.
Injective BBTrend Reached Highest Levels Since November 2024
Injective was launched with the promise of being a layer-1 blockchain to revolutionize finance. Its BBTrend currently stands at 11.05, just shy of its recent peak of 11.36, reached a few hours ago. This marks its highest level since late November 2024, reflecting a significant recovery from -4.58 just two days ago on January 4.
BBTrend, derived from Bollinger Bands, measures the strength and direction of a price trend. Positive values indicate upward momentum, and negative values suggest bearish conditions.

At its current level, INJ’s BBTrend highlights strong bullish momentum, suggesting that buyers are firmly in control and driving the price higher. The sharp recovery from negative territory shows a shift in market sentiment, favoring a continued uptrend.
However, with BBTrend near its recent highs, a stabilization or mild pullback could occur if buying pressure cools, though the overall trend remains positive. Traders should monitor whether INJ price can sustain this momentum or if a consolidation phase emerges in the short term.
INJ Price Prediction: A New 36.4% Surge Ahead?
The EMA lines for INJ price indicate that the price is on the verge of forming a golden cross. That happens when a short-term EMA crosses above a long-term EMA. If this occurs, it could reignite buying momentum and propel INJ to test the resistance at $26.5, as the narrative around crypto trying to revolutionize TradFi gains grows.
A breakout above this level might pave the way for further gains, with $29.4 as the next key target. If momentum remains strong, INJ could even test $35.2, a level not seen since early December 2024.

Conversely, if the trend reverses and the golden cross fails to materialize, INJ price could face downside pressure. The first critical support lies at $23.98, and a break below this level could lead to further declines. In a more bearish scenario, the price could fall to $19.7.
Disclaimer
In line with the Trust Project guidelines, this price analysis article is for informational purposes only and should not be considered financial or investment advice. BeInCrypto is committed to accurate, unbiased reporting, but market conditions are subject to change without notice. Always conduct your own research and consult with a professional before making any financial decisions. Please note that our Terms and Conditions, Privacy Policy, and Disclaimers have been updated.


Leave a Comment