- Bitcoin’s lower Hash Price suggested it may be nearing a price bottom, potentially signaling a rebound.
- Increasing active addresses and rising Stock-to-Flow ratio pointed to growing market confidence and scarcity.
Bitcoin [BTC]’s recent movements in Hash Price aligned with past patterns, suggesting the cryptocurrency could be approaching a bottom. At press time, Bitcoin was trading at $80,101.35, down by 7.67% in the last 24 hours.
Historically, lower Hash Price periods have marked Bitcoin’s price bottoming out, signaling that a potential rebound could be on the horizon.
As BTC tests these key levels, it raises the question—could this be an ideal accumulation phase before the next bull run?
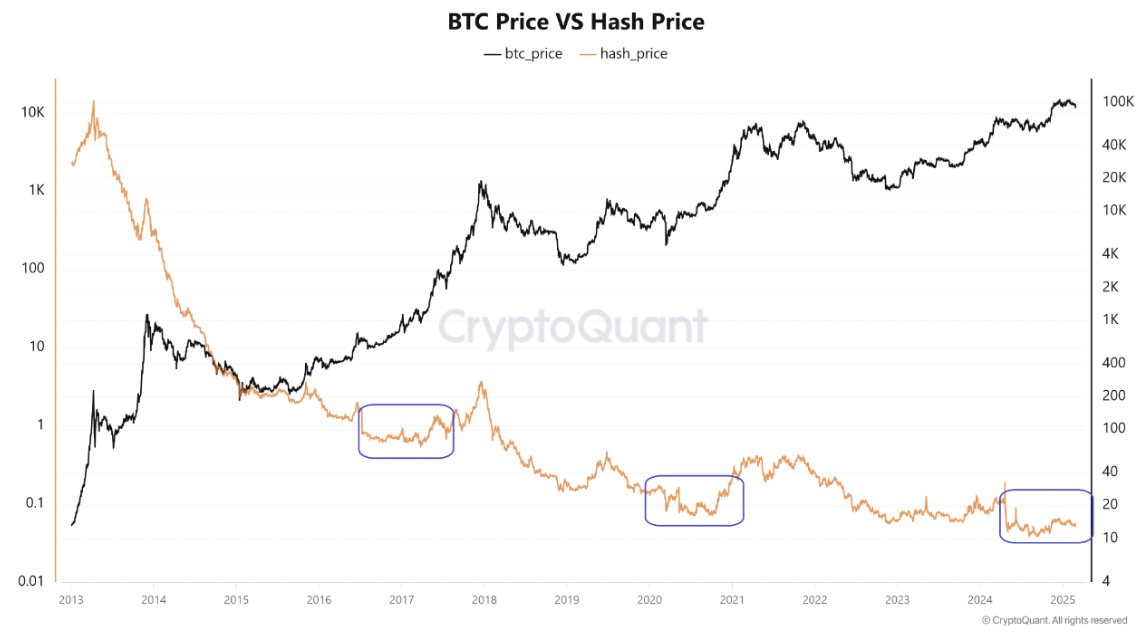

Source: CryptoQuant
Bitcoin’s in/out of the money chart reveals interesting insights into the current market sentiment. A large portion of BTC, approximately 75.30% (14.95 million BTC), remains “in the money,” showing most investors are still in profit.
However, 23.23% (4.61 million BTC) of Bitcoin addresses are “out of the money.” This shows that while most Bitcoin holders remain profitable, the market is not without its challenges.
BTC: The growing activity on the blockchain suggests…
Bitcoin’s address statistics offer further insights into the market’s direction. Active addresses have increased by 6.30% over the last 7 days, reflecting growing participation in the Bitcoin network.
The pink line, representing active addresses, shows a steady rise, closely mirroring Bitcoin’s price movements. Meanwhile, the number of zero-balance addresses has risen by 24.78%, signaling that many new users are actively holding or trading Bitcoin rather than abandoning their wallets.
This surge in activity, especially with the increase in new addresses (26.04% over the past week), suggests that market confidence is growing. This could lead to a price rebound if BTC continues to gain momentum.
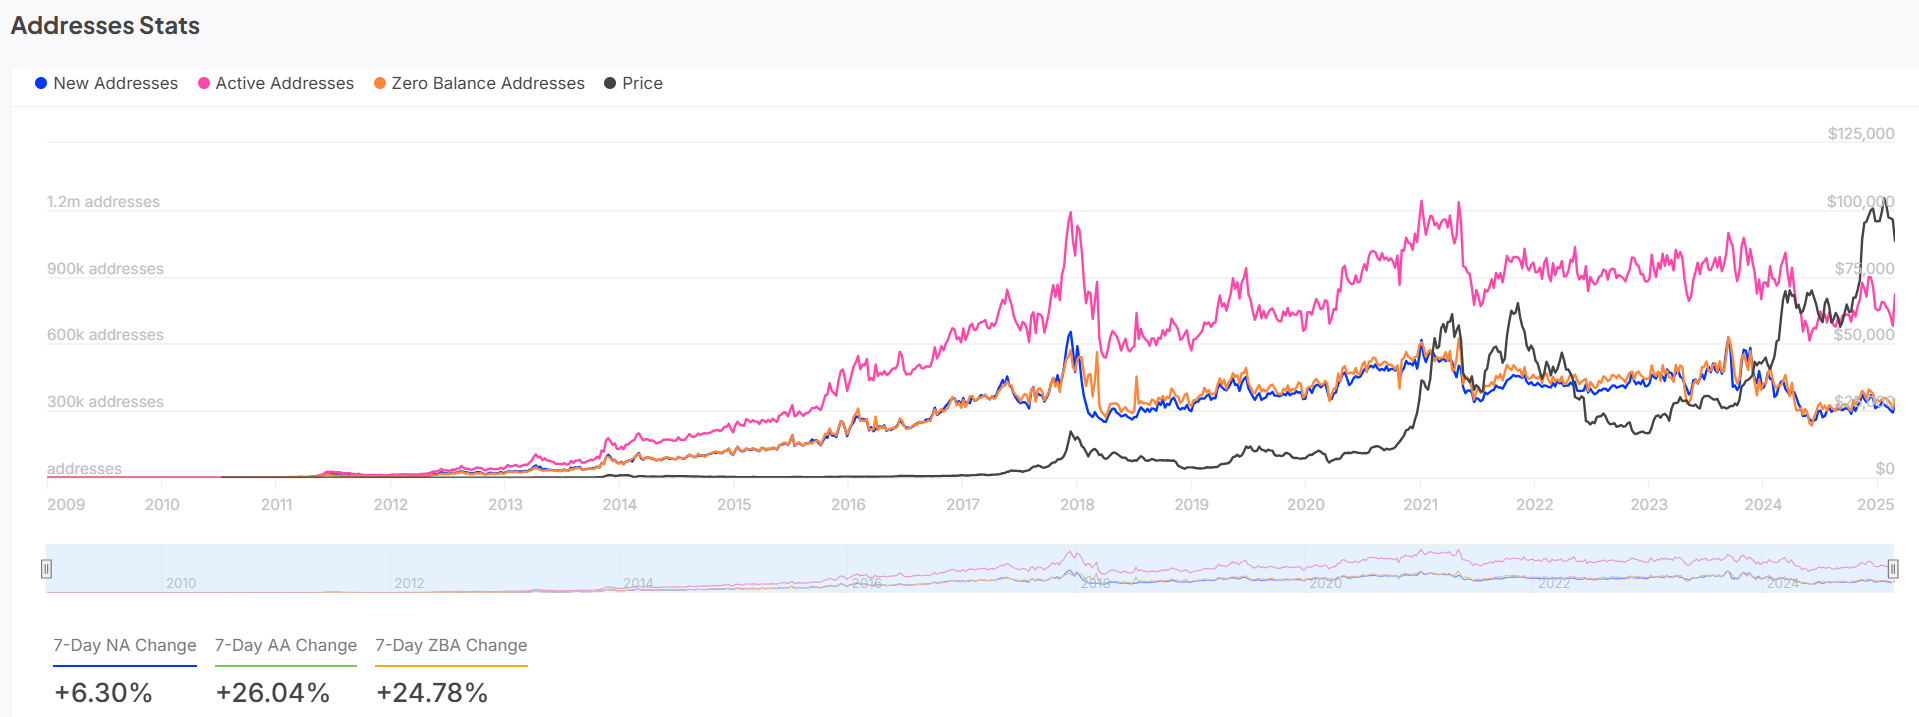

Source: IntoTheBlock
Breakout ahead? Technical indicators show…
Bitcoin’s technical analysis shows crucial support and resistance levels.
At the time of writing, BTC was testing support at around $80,216, a level that has seen previous price reactions. However, the downward trendline and the breakdown of key support levels suggest BTC is under pressure.
Additionally, the Stochastic RSI reading of 2.23 signals an oversold condition, which often precedes a price reversal. The Bollinger Bands also point to a tightening pattern, indicating that volatility may increase soon.
These technical indicators suggest BTC could either bounce from this support level or break down further, depending on future market developments.


Source: TradingView
BTC stock-to-flow ratio: Increasing scarcity fuels…
Bitcoin’s Stock-to-Flow ratio has surged by 100% in the last 24 hours, reaching 2.1152M. This indicates an increase in Bitcoin’s scarcity, as the rate of new supply continues to decrease.
The rising Stock-to-Flow ratio suggests that, while BTC faces short-term price volatility, its long-term value proposition remains intact.
As fewer BTC coins are introduced to circulation over time, scarcity will drive up demand, potentially pushing prices higher.


Source: CryptoQuant
Is Bitcoin preparing for a rebound?
Based on current analysis, Bitcoin is approaching a potential bottom. The lower Hash Price, combined with increasing active addresses, signals a potential price reversal.
Although technical indicators like the Stochastic RSI point to an oversold condition, Bitcoin is likely to experience increased buying activity. Scarcity continues to drive value.
Source: https://ambcrypto.com/is-bitcoin-nearing-a-rebound-these-metrics-say-yes/


Leave a Comment