- Celestia was trading within a bullish structure that positioned it for a potential major upswing.
- Technical indicators remained bullish, but on-chain metrics presented mixed signals.
Over the past week, Celestia [TIA] has declined by 17.25%, reflecting sustained bearish pressure. The downturn continued in the last 24 hours, with an additional 1.77% drop, pulling the asset lower.
Despite this, the likelihood of a rebound remains high, as multiple patterns and confluences suggested a potential recovery, though delays may occur, according to AMBCrypto’s analysis.
Double bullish patterns: Is a run-up ahead for TIA?
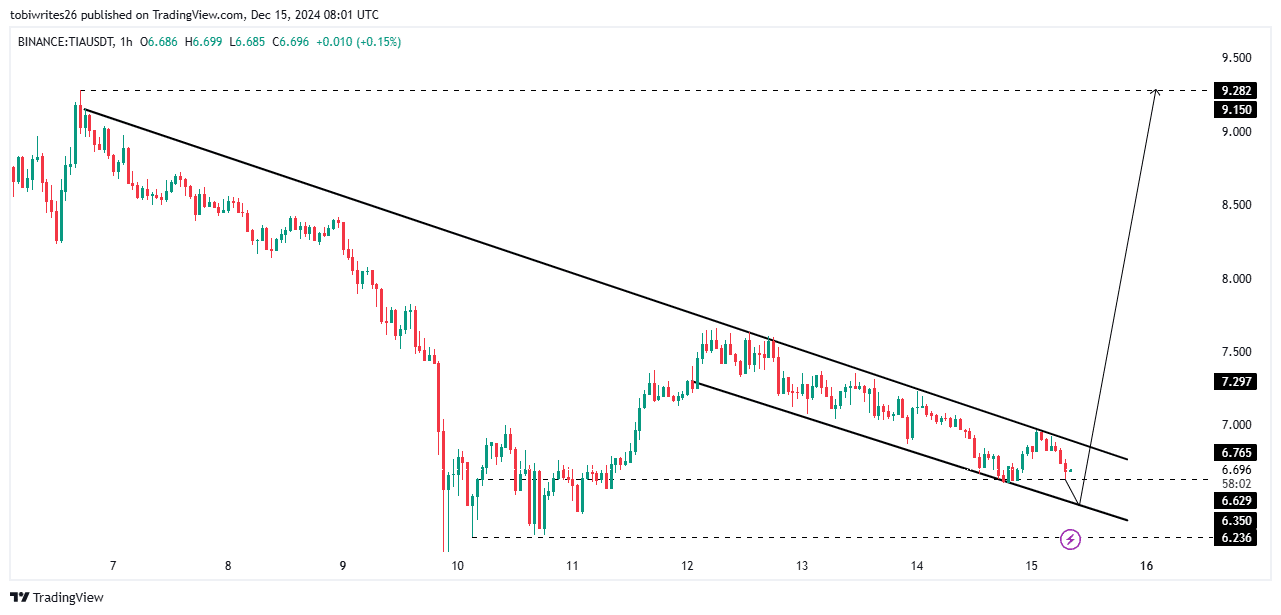
TIA was trading within two bullish patterns: an extended descending trendline and a descending channel. Both patterns suggested the potential for an upward move.
Key levels to watch include the $6.629 support line. If this level holds, a bounce could follow. However, a failure to maintain this support may push TIA down to the next support level along the descending trendline.
And an increased selling pressure at this stage could drive the price further down to the $6.236 base support level.


Source: Trading View
Analysis indicates that a drop to the second support level is more likely, as highlighted by the chart’s arrow. From there, a rebound is expected, with a potential rally to a new high of $9.2.
Liquidity shifts toward the bulls
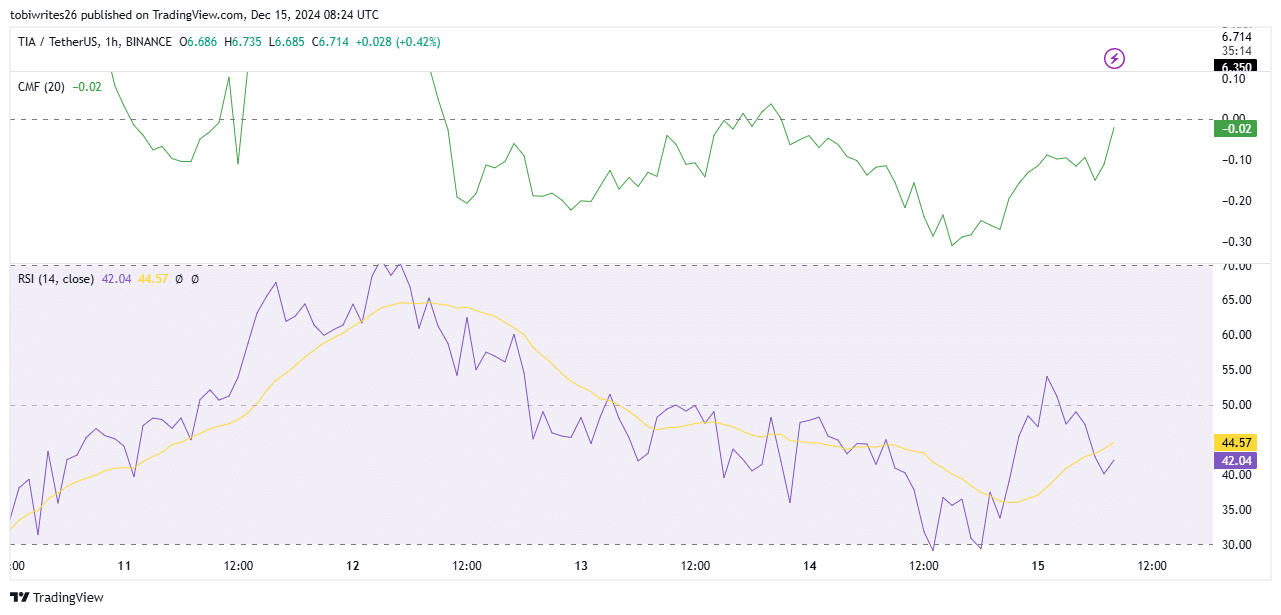
Increased buying pressure has been observed in the market, as the Chaikin Money Flow (CMF) shows an upward surge.
Although the current CMF reading is at -0.02, its upward trajectory signals growing strength for the bulls.
The CMF, a technical indicator that gauges market strength based on buying and selling volume pressure, currently points to a bullish market, supporting a positive outlook for TIA.


Source: Trading View
Similarly, the Relative Strength Index (RSI) has been trending upward, moving closer to the bullish zone with a reading of 42.04.
The RSI, a momentum oscillator, measures the speed and magnitude of price changes to determine whether an asset is overbought or oversold.
While TIA’s RSI has yet to cross into either extreme, its upward movement indicates growing bullish momentum. A firm shift into bullish territory is expected once the RSI surpasses the 50 level.
If these trends persist, a sustained upward move for TIA appears likely, with price stabilization potentially occurring at one of the first two support levels.
Mixed signals put TIA under pressure
TIA is facing conflicting signals from on-chain metrics. While the Funding Rate remains bullish, other indicators, including Open Interest and long liquidations, suggest growing bearish pressure.
The Funding Rate, which reflects the cost of maintaining the price parity between spot and Futures markets, is holding at a modest 0.0083%, signaling bullish sentiment among traders.


Source: Coinglass
However, Open Interest—a measure of active futures contracts—has declined further, dropping 4.16% in the past 24 hours to $276.48 million.
This consistent downtrend indicates a growing number of unsettled short positions, intensifying the downward pressure on TIA’s price.
Read Celestia’s [TIA] Price Prediction 2024–2025
Adding to this, the bearish momentum has forced significant long liquidations. At the time of writing, $1.06 million worth of long positions have been liquidated, further driving prices lower.
If these bearish metrics continue to weaken, TIA’s decline could persist. A reversal would require a shift in these indicators alongside stronger bullish momentum.
Source: https://ambcrypto.com/celestia-tia-hits-9-6-but-uncertainty-lingers-about-next-moves/


Leave a Comment