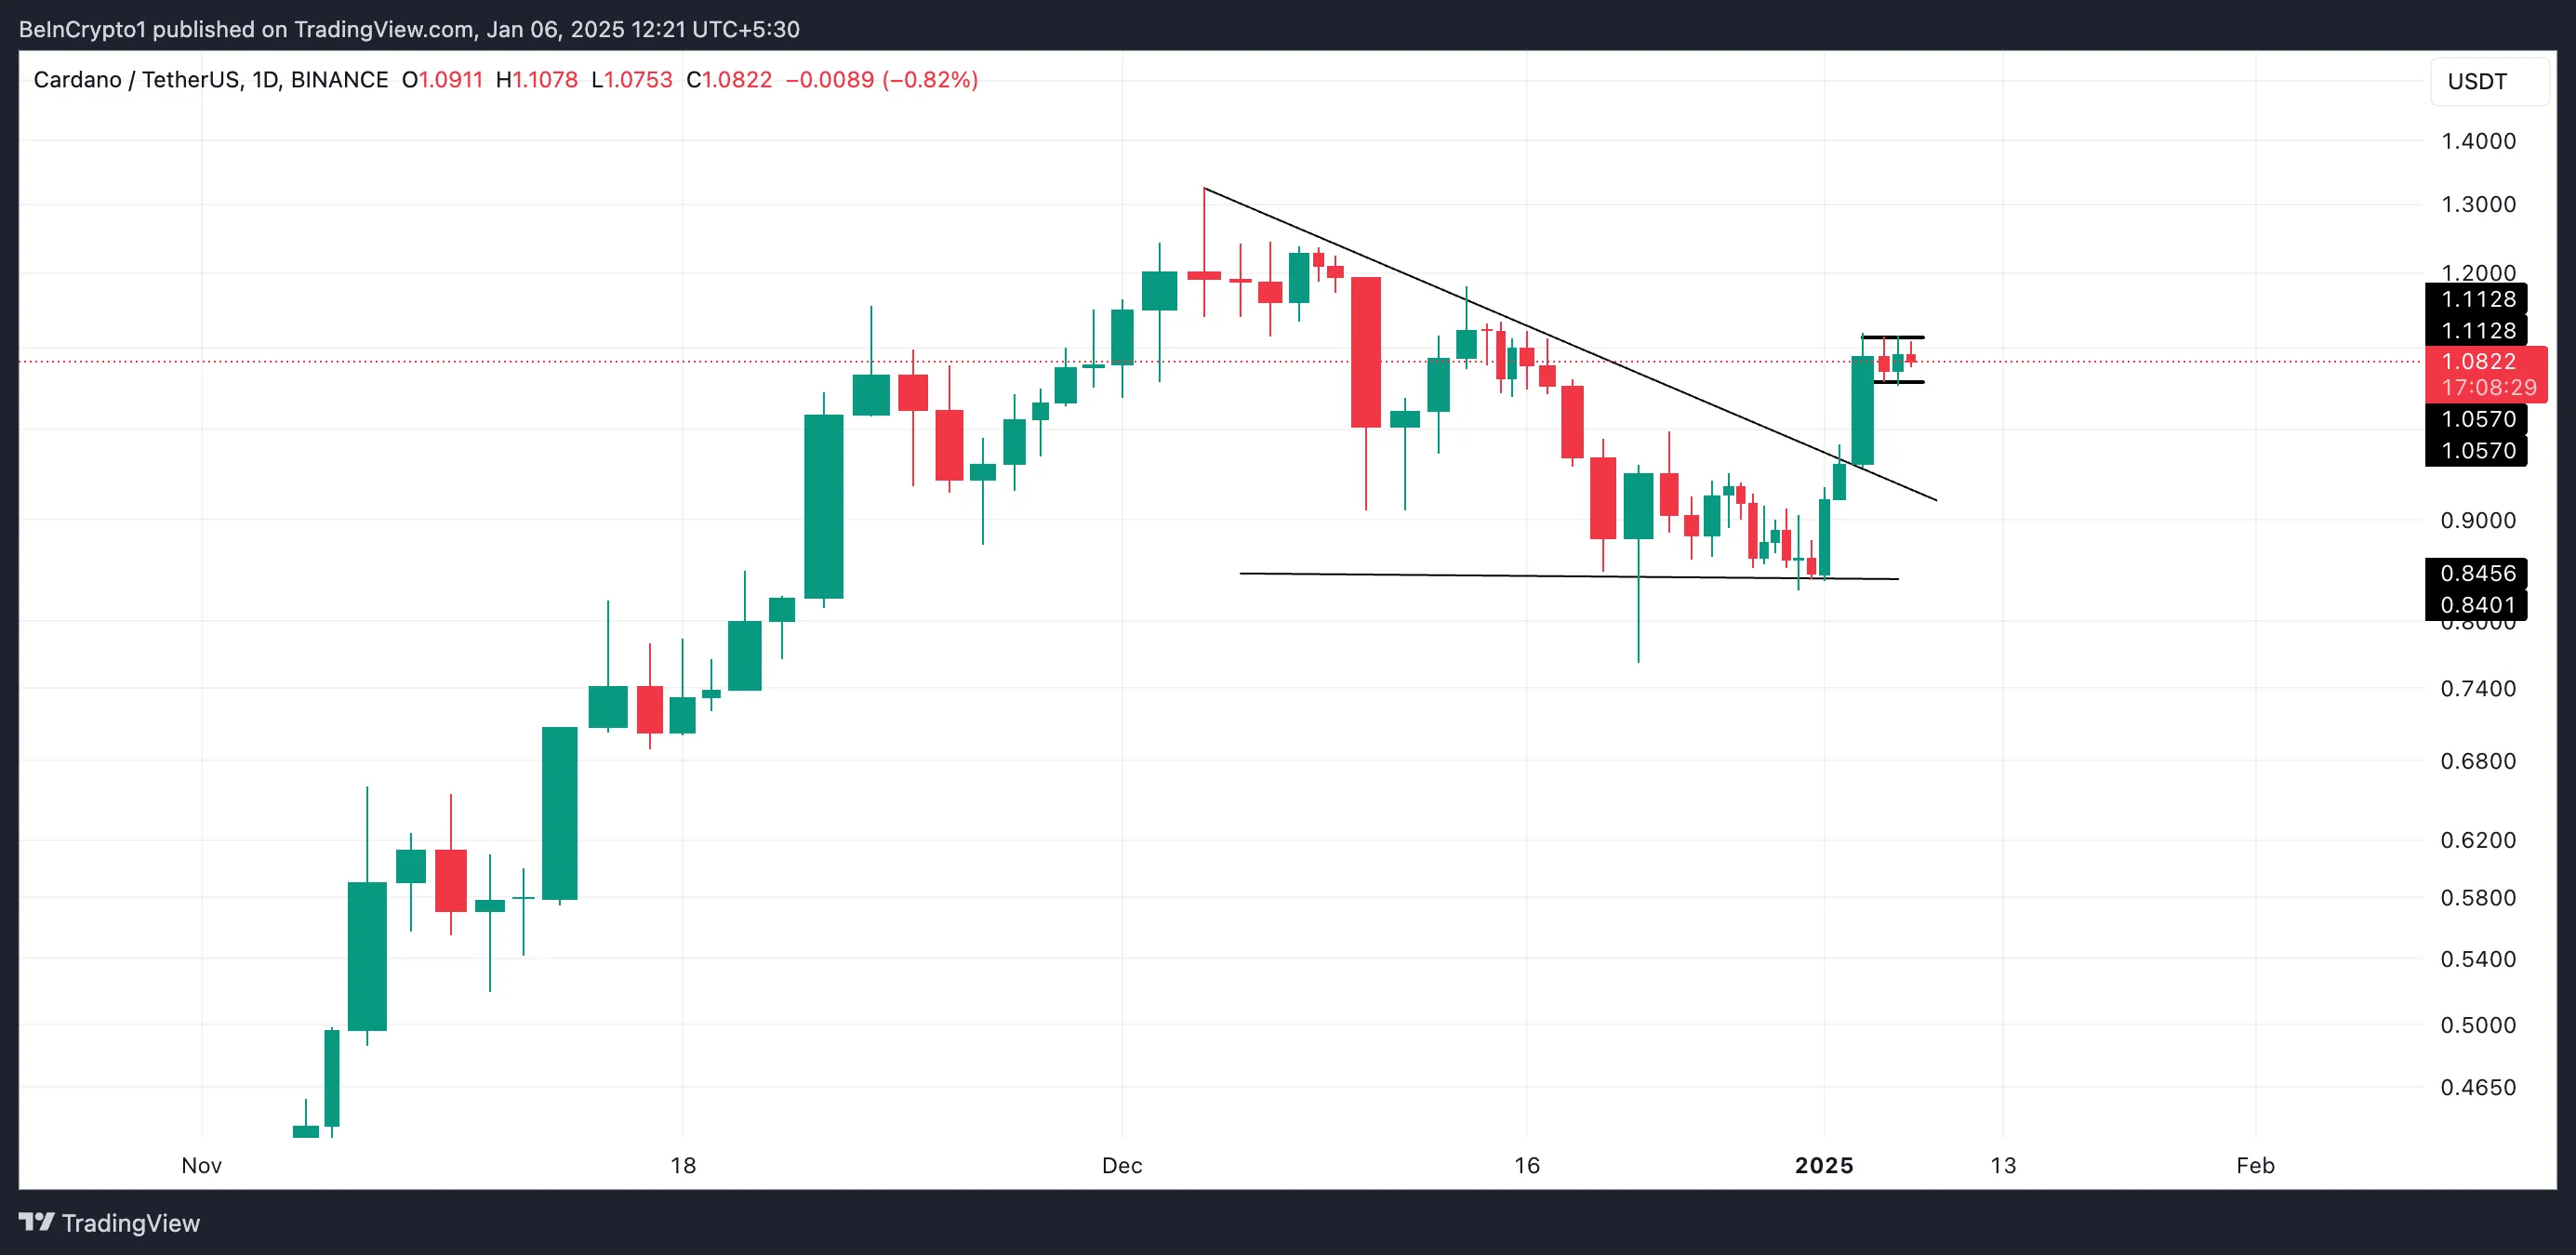
Cardano (ADA) surged 25% over the past week, breaking above a key resistance level — the upper line of a descending triangle pattern. This bullish breakout initially sparked optimism, with the market eyeing a potential return to its two-year high of $1.32.
However, the rally has since stalled. In the past two days, buying pressure has weakened, causing ADA’s price to consolidate within a narrow range.
Cardano Loses Steam as Traders Watch From the Sidelines
Last week, Cardano’s rally pushed its price above the upper line of the bearish descending triangle pattern it had traded within in the weeks prior. BeInCrypto reported that this bullish breakout initially fueled optimism as traders set their sights on a potential reclaim of its two-year high of $1.32.
However, due to waning buying pressure, ADA’s price has consolidated within a narrow range over the past two days. It has faced resistance at $1.11 and has found support at $1.05.

When an asset’s price trades within a narrow range, it indicates a period of indecision in the market, where buyers and sellers are evenly matched. Usually, consolidation precedes a significant price movement as traders wait for a breakout or breakdown to signal the next trend direction. With technical indicators showing plummeting buying activity, ADA’s price might shed some of its recent gains.
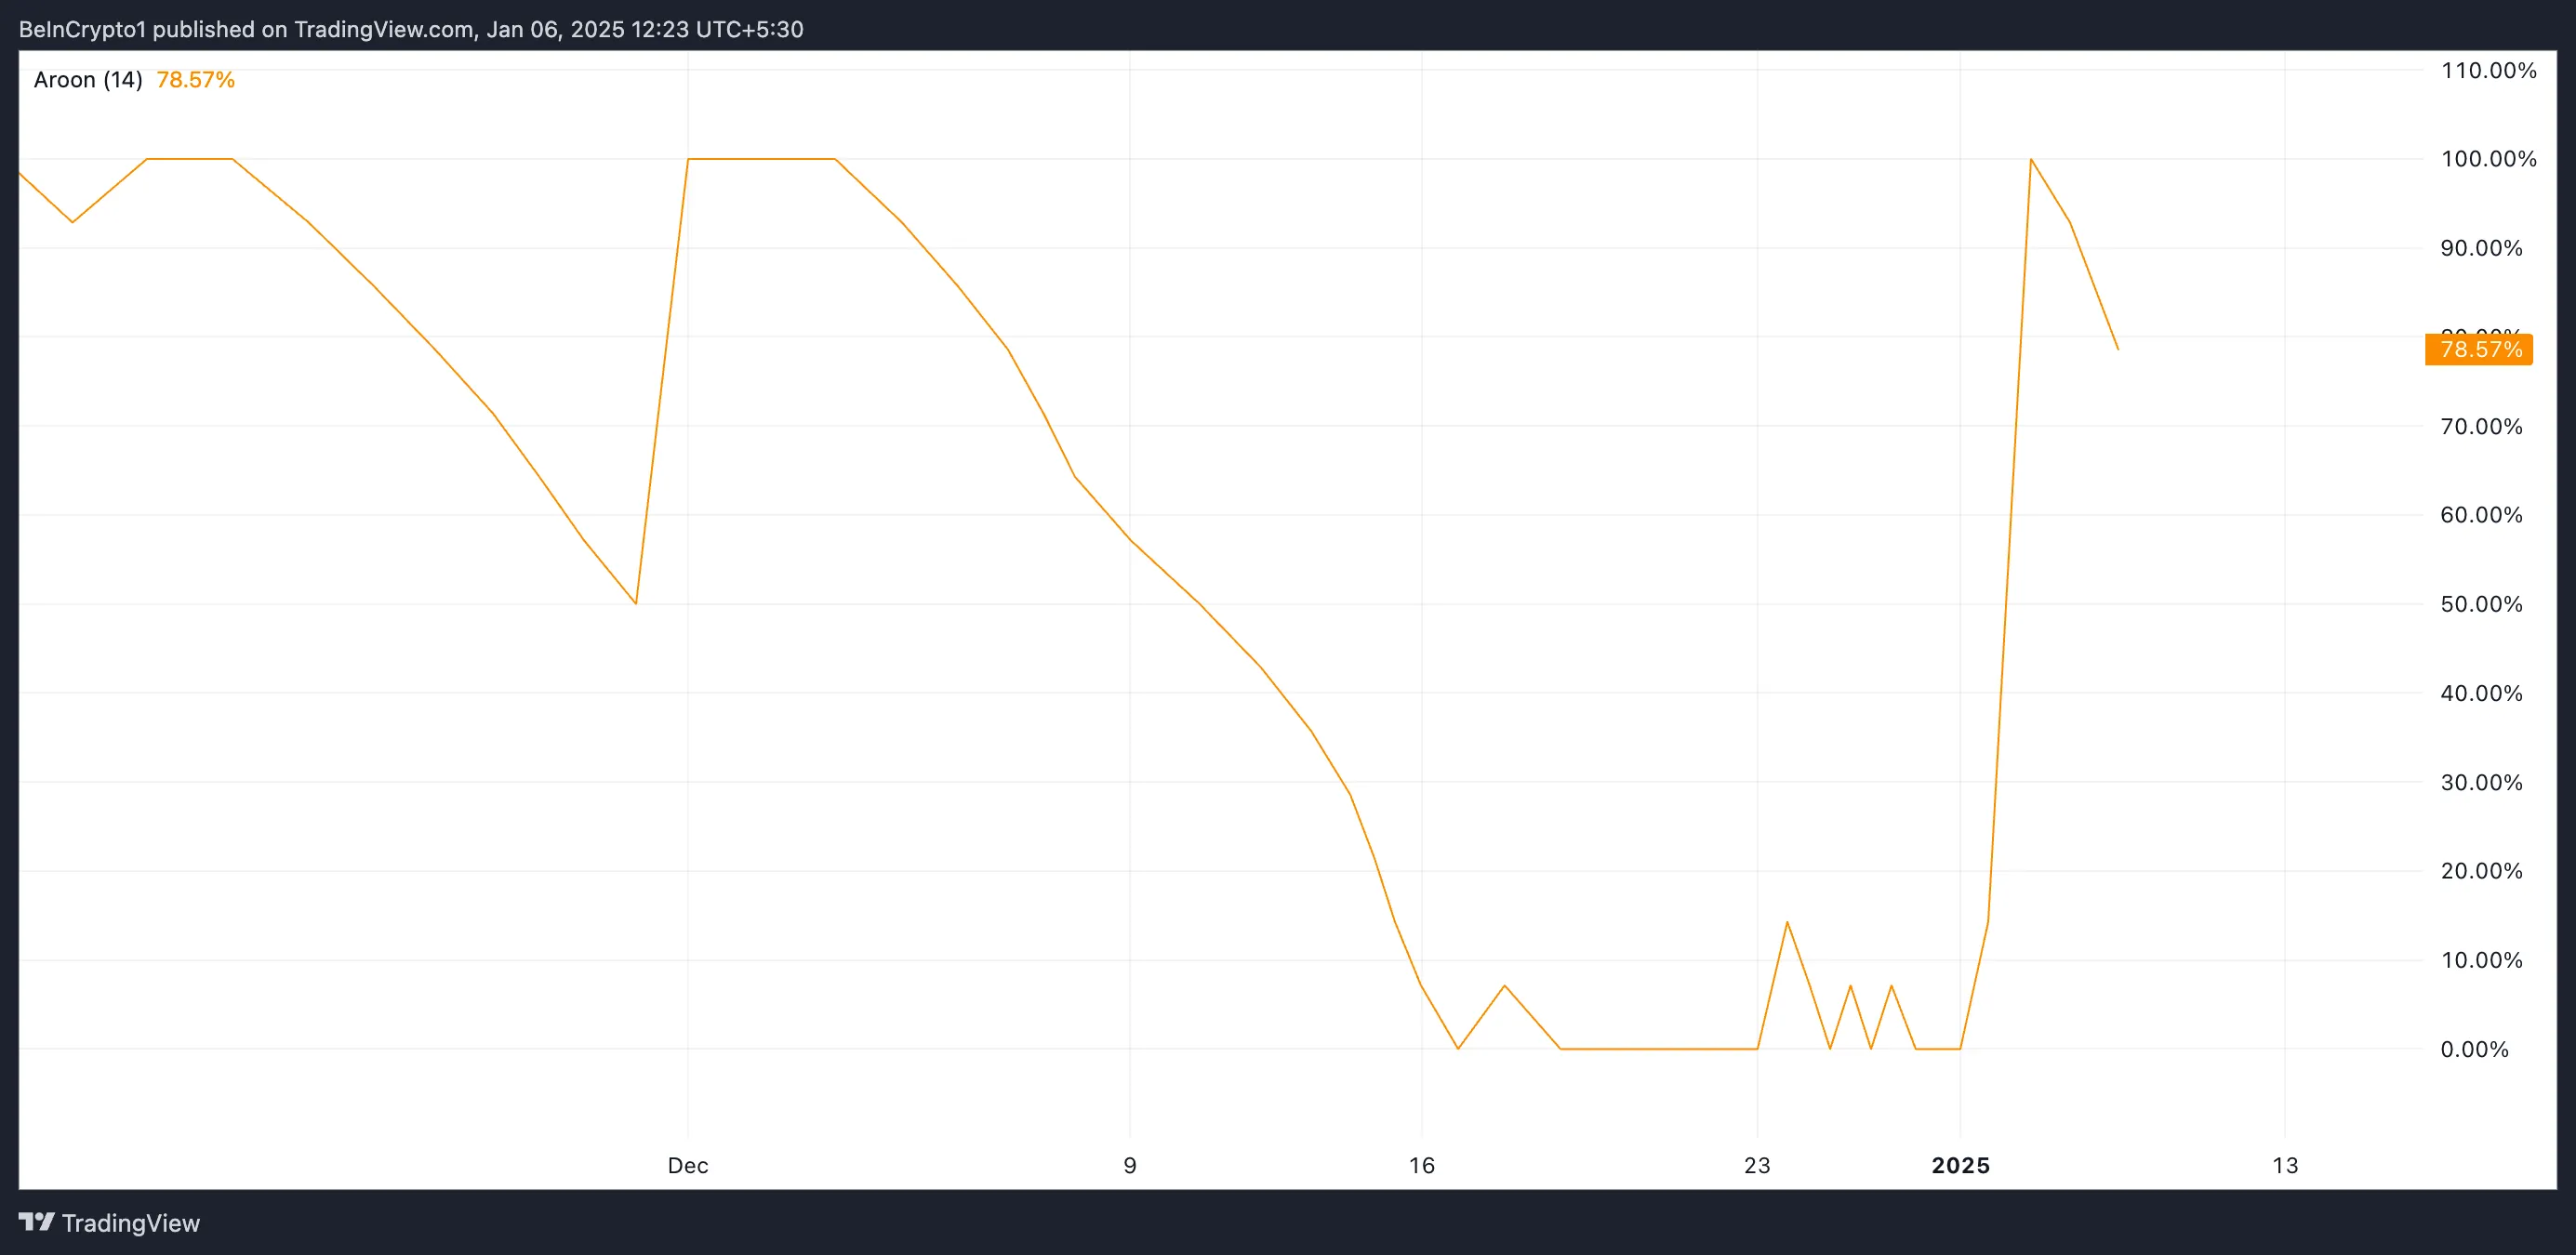
For example, readings from its declining Aroon Up line support this bearish outlook. As of this writing, the indicator is in a downward trend and has been since the price consolidation started.

The Aroon indicator measures the strength and direction of a trend by analyzing the time since an asset’s recent highs (Aroon Up) and lows (Aroon Down). When the Aroon Up line is declining, the asset’s recent highs are becoming less frequent, indicating weakening bullish momentum or a potential shift toward a downtrend.
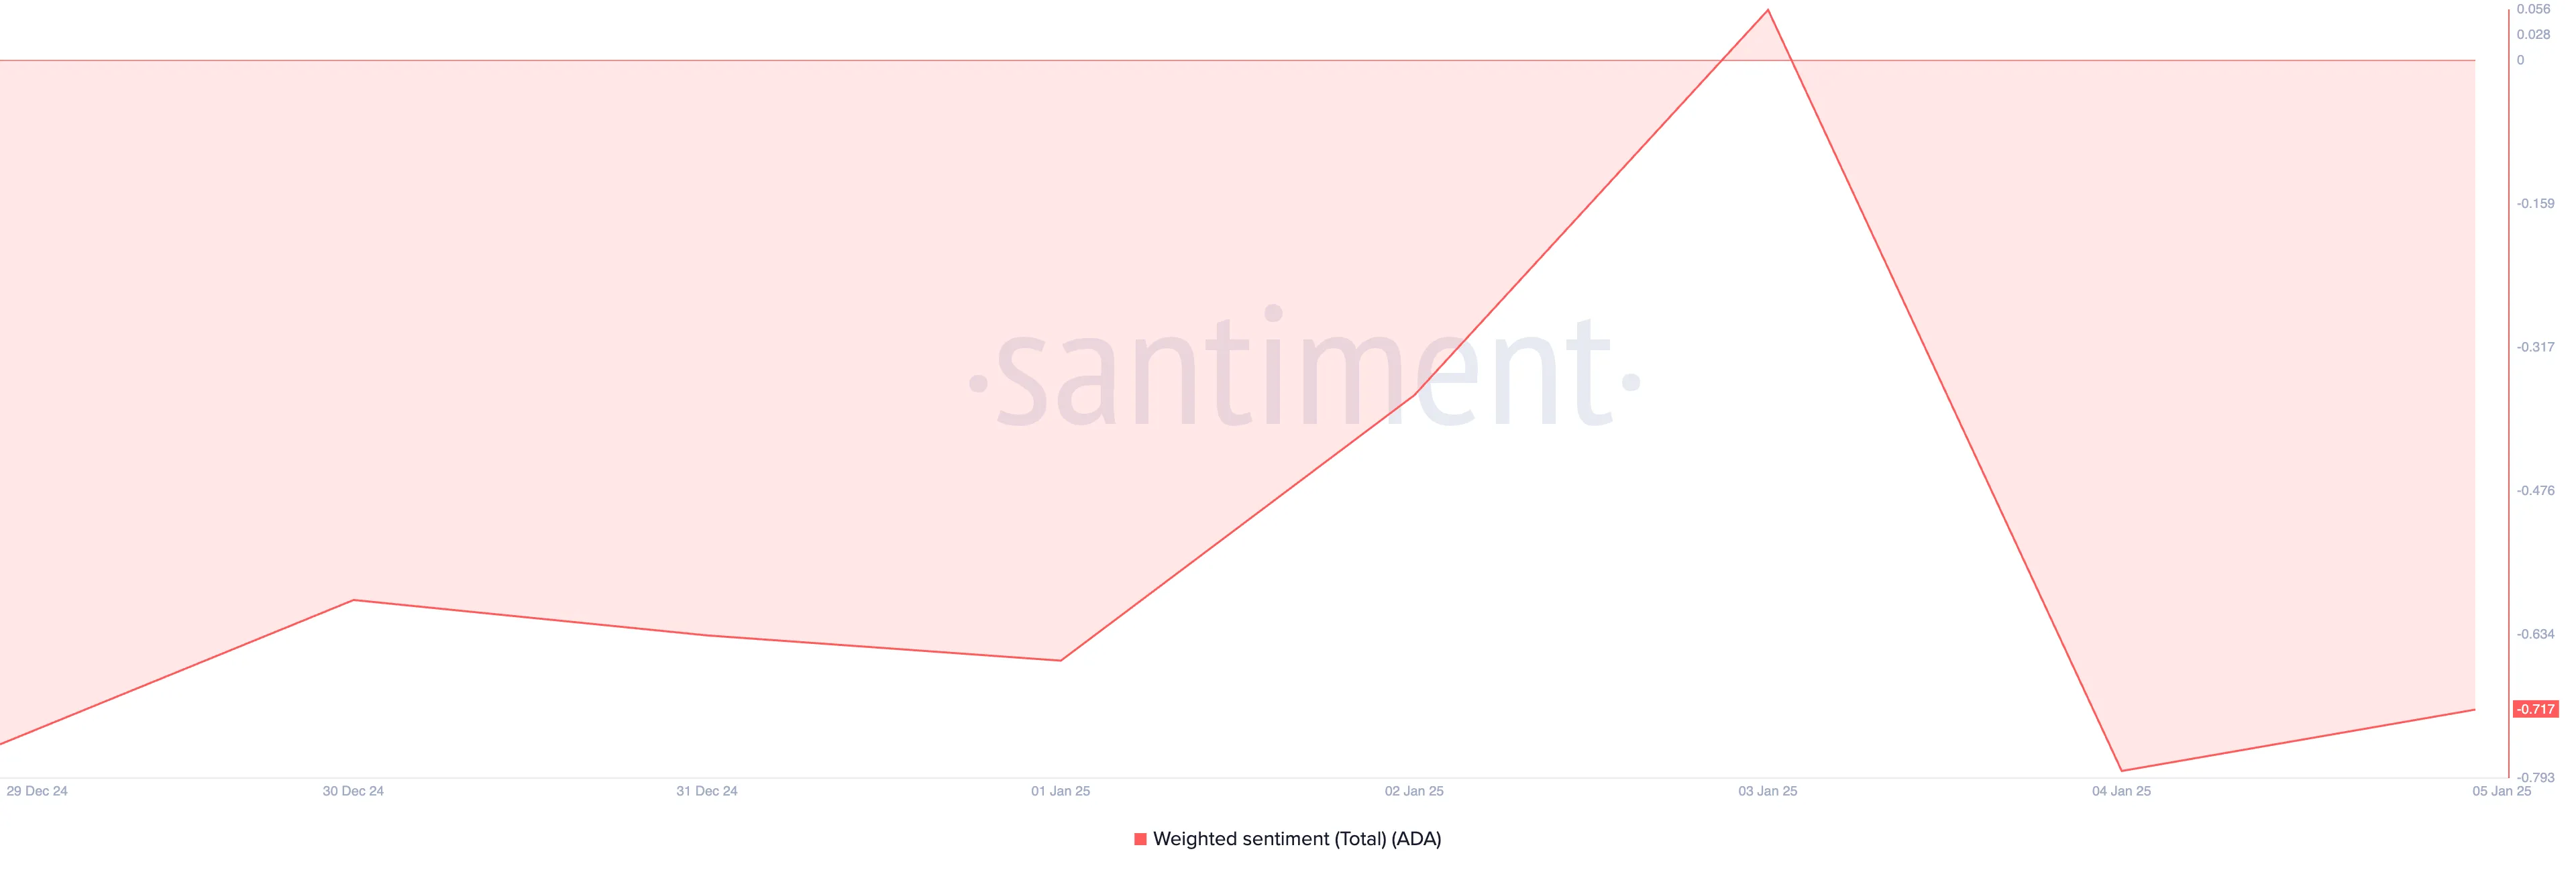
Further, ADA’s negative weighted sentiment reflects the growing bearish bias toward the altcoin. As of this writing, this stands at -0.71.

When an asset’s weighted sentiment is negative, it indicates that overall market sentiment, measured from social data, is bearish. This suggests traders and investors are more pessimistic than optimistic, which could weigh on the asset’s price performance.
ADA Price Prediction: Bullish Breakout or Further Decline?
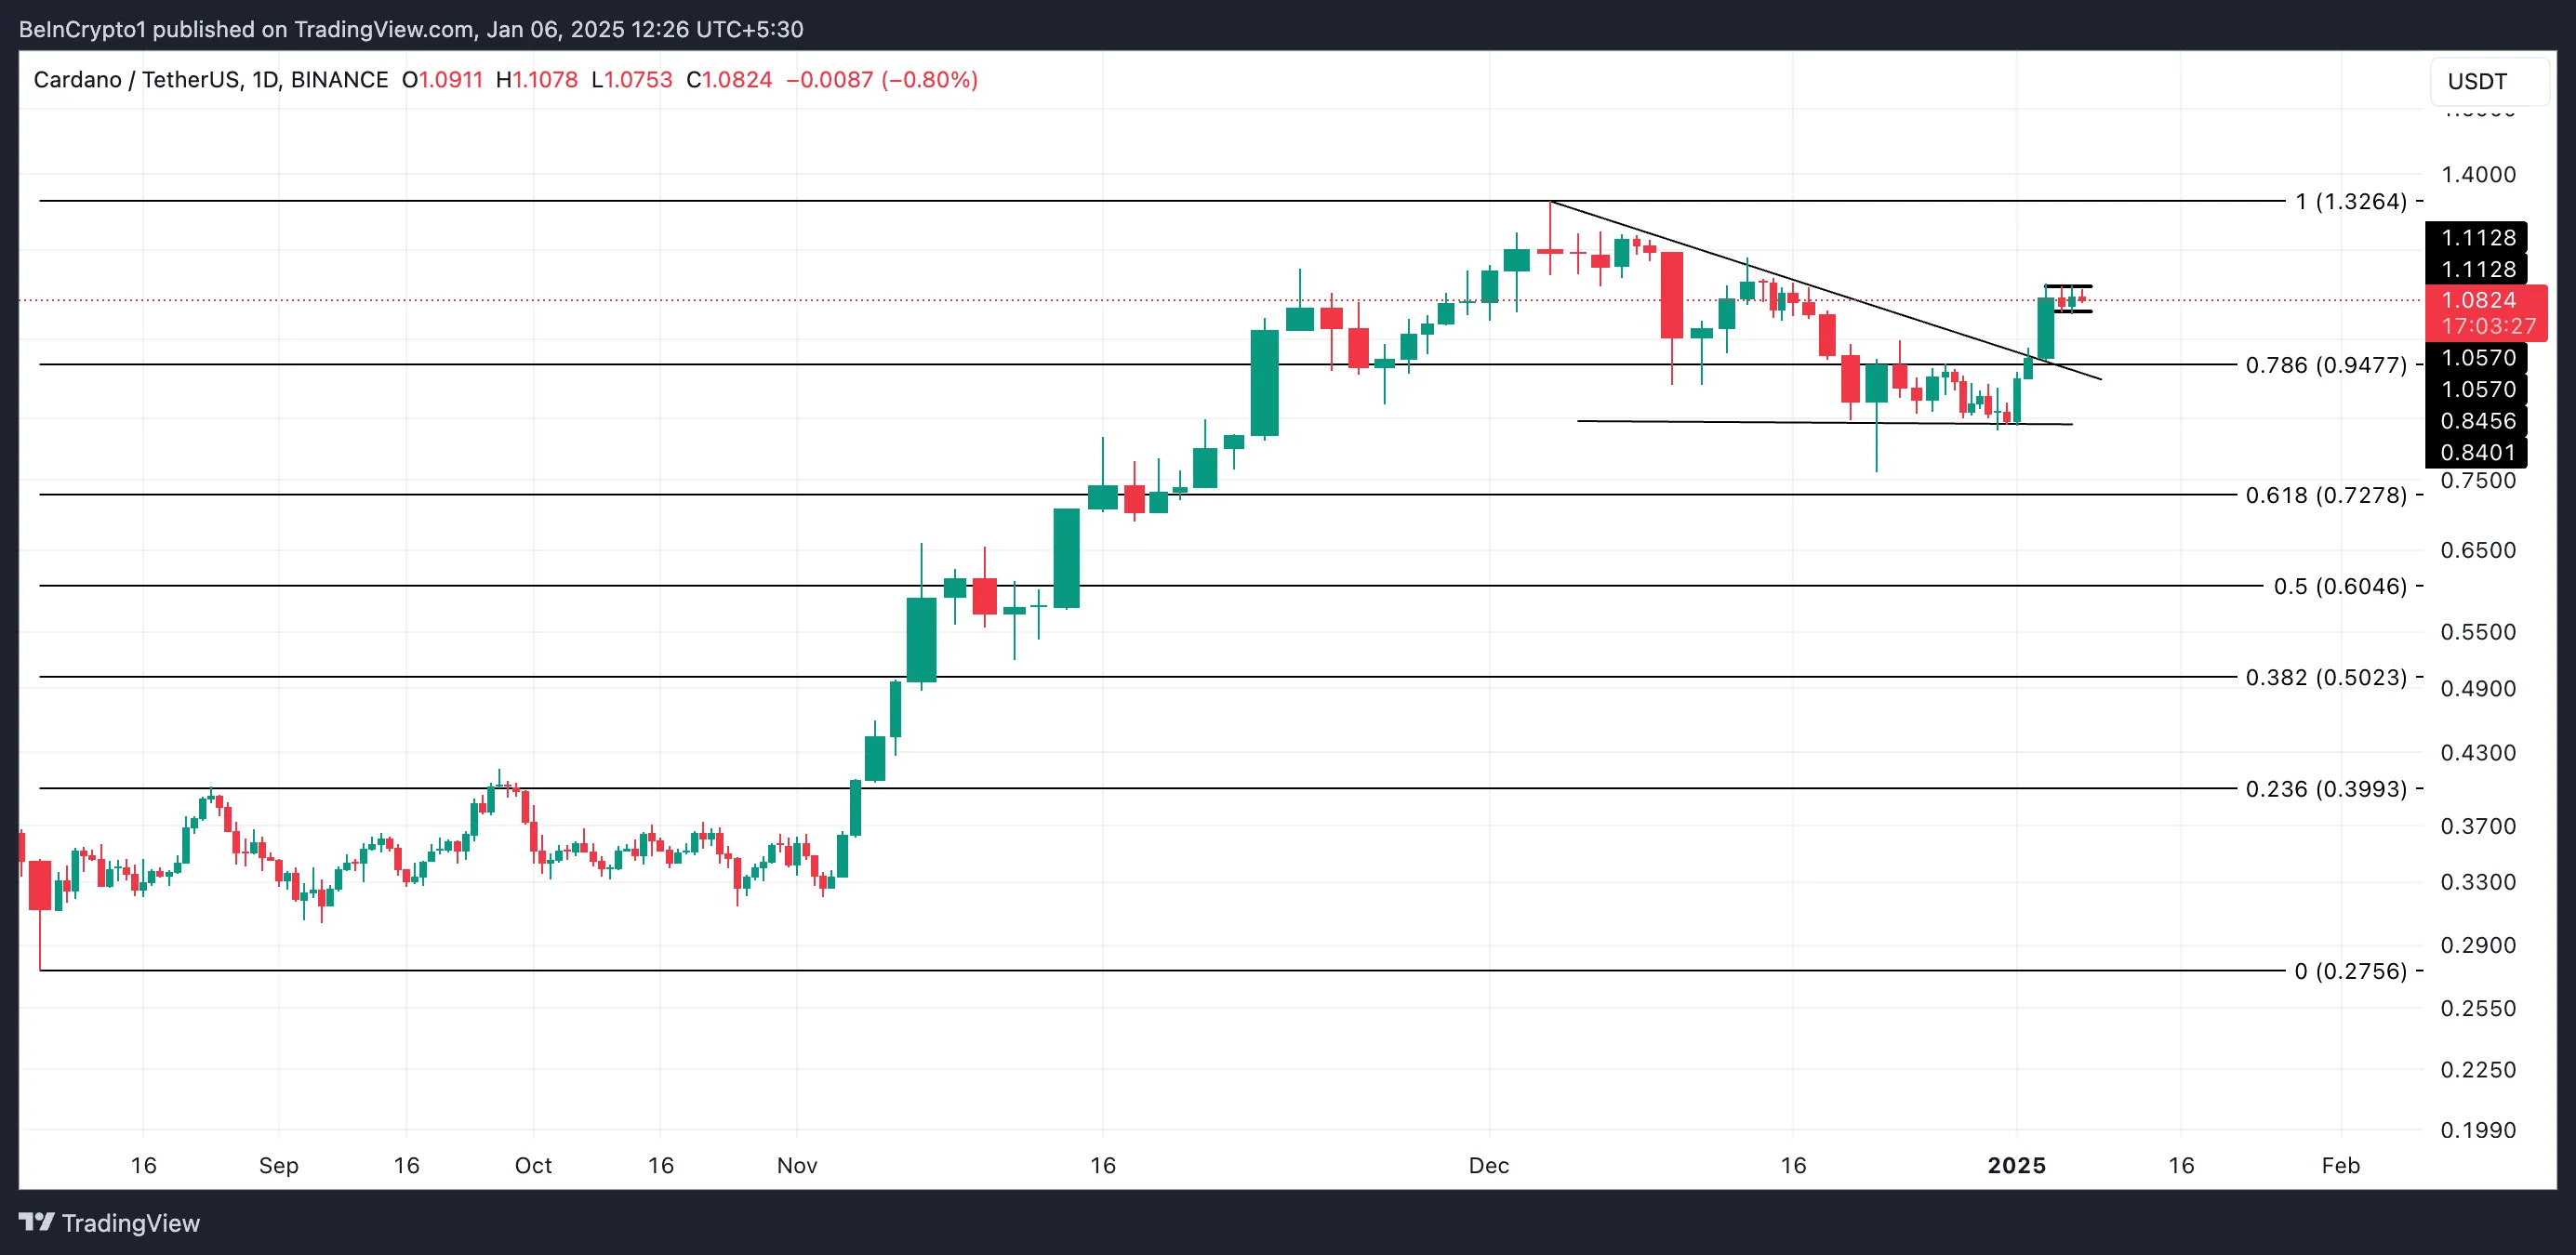
At press time, ADA trades at $1.08. The growing bearish bias toward the coin could pull it toward the $1.05 support zone. If the bulls fail to defend this level, the coin’s price could fall below the $1 mark to trade at $0.94.

On the other hand, if market sentiment shifts and becomes bullish, the Cardano price could break above the $1.11 resistance level and reclaim its two-year high of $1.32.
Disclaimer
In line with the Trust Project guidelines, this price analysis article is for informational purposes only and should not be considered financial or investment advice. BeInCrypto is committed to accurate, unbiased reporting, but market conditions are subject to change without notice. Always conduct your own research and consult with a professional before making any financial decisions. Please note that our Terms and Conditions, Privacy Policy, and Disclaimers have been updated.


Leave a Comment