Solar eruptive events, such as flares and coronal mass ejections (CMEs), can generate shock waves that propagate through the solar corona. These shock waves accelerate electrons, leading to Langmuir waves that are then converted into radio emission of type II solar bursts, which are radio signatures of these shocks. On solar spectrograms, type II bursts are typically characterized by fundamental and harmonic lanes drifting from high to low frequencies within 0.1-0.4 MHz/s and durations of up to 30 minutes (Alissandrakis & Gary 2021).
In addition to their typical appearance, type II bursts exhibit a variety of spectral peculiarities, including herringbones, spectral breaks, and bumps (Koval et al. 2021, 2023). Another common phenomenon is band-splitting, where the fundamental and harmonic lanes split into upper and lower frequency bands (Vršnak et al. 2002). There are two main interpretations for band-splitting, involving emissions from either the upstream and downstream regions of a shock or distinct parts of the shock (Chrysaphi et al. 2018; Bhunia et al. 2023). The current study focuses on a newly identified feature called “spectral cleaving”, which differs from band-splitting. Spectral cleaving manifests as an actual branching of a type II burst lane as observed in an event on February 14, 2011.
Data Analysis
We analyzed dynamic spectra from the Nançay Decametric Array (NDA; France) and the URAN-2 (Ukraine) radio telescope to study the 2011-02-14 type II solar burst in detail (see Figure 1). The event spectrogram includes the structured type II burst, entitled as Type II, which shows band-splitting with lower-frequency band (LFB) and upper-frequency band (UFB).
Figure 2 presents the dynamic spectrum recorded by the URAN-2 radio telescope, where we observed the LFB of the Type II undergoing spectral cleaving at around 13:09:40 UT. Notably, the UFB of the burst remained unaffected by this cleaving, maintaining its typical band-splitting behavior. In addition to the Type II with spectral cleaving, the URAN-2 data revealed a secondary type II burst, labeled “HB Type II”, characterized by a herringbone structure and band-splitting.
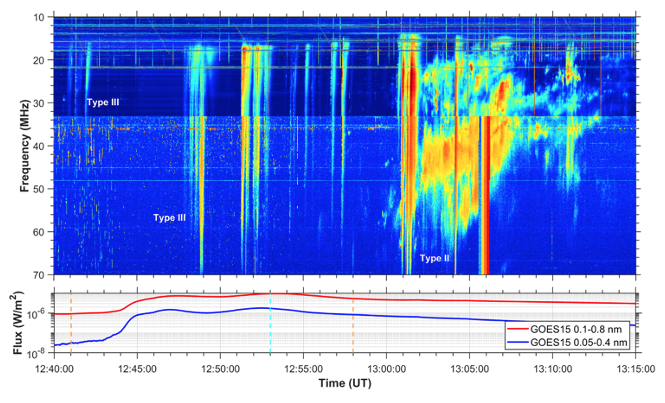
Figure 1. Dynamic spectrum of the type II burst on 2011 February 14. The combined spectrum was obtained from records of the URAN-2 (10-33 MHz) and NDA (33-70 MHz) antenna arrays. The type II burst and several groups of type III bursts are denoted in the spectrogram as Type II and Type III, respectively. The lower panel shows the solar X-ray emission measured by GOES 15 on that day. The C9.4 class flare start, end, and peak times are shown as dashed vertical orange and cyan lines, respectively. The common time axis is in the range 12:40-13:15 UT.
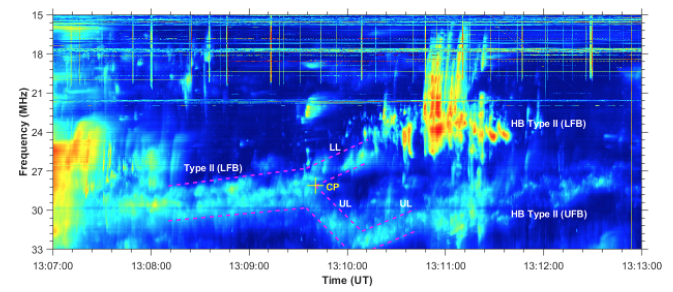
Figure 2. URAN-2 dynamic spectrum with the low-frequency band of the type II burst, Type II (LFB), showing the spectral cleaving. The dashed purple lines encompass the LFB before and after the cleaving point (CP), which was at the time instant of 13:09:40.5 UT and at a frequency of 28.12 MHz. The LFB divided into a lower lane (LL) and an upper lane (UL) as a result of the spectral cleaving. The UL ascends and descends in frequency, making a spectral bump feature. The type II burst with herringbones has a band-splitting with lower and upper frequency bands, which are indicated as HB Type II (LFB) and HB Type II (UFB).
Interpretation
We propose an initial interpretation of the newly identified spectral cleaving feature in type II bursts. We assume that the electrons responsible for the type II emission are accelerated by the shock-drift acceleration mechanism (Holman & Pesses 1983). In this model, the shock’s efficiency at accelerating electrons depends on the angle ψ1 between the magnetic field and the shock normal. The maximum electron acceleration is at very high angles (≈90°) and depends on the shock wave parameters. Thus, sources of a type II burst emission are assumed to be located close to the regions on a shock front in which electrons are most efficiently accelerated. This implies that these regions are not everywhere at the shock front, but only where ψ1 ≈ 90°, excluding ψ1 ≃ 90°.
We assumed that two radio sources correspond to the LFB and UFB of the Type II. Moreover, the LFB radio source was assumed to be a double source composed of two components (see Figure 3a). Then, at about 13:09:40 UT, the Type II (LFB) divides into two lanes (LL and UL), which is the spectral cleaving (Figure 2). We attribute the spectral cleaving to changes in the magnetic field orientation ahead of the propagating shock front. When this orientation varies, the region of the most effective electron acceleration (sources of the Type II (LFB) emission) shifts along the shock front or even diverges, as shown in the scenario in Figure 3.
In our case, the shock front most likely propagates in a direction that is highly different from the radial direction in the gravitationally stratified solar atmosphere. Thus, in the Type II (LFB) during the time period of 13:07:30-13:09:40 UT, the condition (ψ1 ≈ 90°) for the most effective acceleration is fulfilled only in the regions close to the top of the shock front (Figure 3a), where the double source is situated (red circles in Figure 3). There electrons are accelerated. These suprathermal electrons gave rise to the subsequent radio emission via the plasma emission mechanism. Since the double source is rather compact, the Type II (LFB) is seen to be not cleaved in the dynamic spectrum.
Later, after 13:09:40 UT, the magnetic field lines ahead of the shock front gradually changed in such a way that around the top of the shock front, ψ1 ≃ 90° (see Figure 3b). Consequently, due to a decrease in electron acceleration efficiency, the radio emission from this location disappeared. Simultaneously, two well-separated regions with high ψ1 appeared along the shock front. The first radio source was located at a higher altitude in the solar atmosphere and the second source was at a lower altitude. Before 13:09:40 UT, they were the components of the double source. Due to the difference in plasma densities between higher and lower sources, the LL and UL of the Type II (LFB) were generated.
The proposed interpretation emphasizes that variations in magnetic field configurations along the shock front lead to the migration of radio sources, which is reflected in dynamic spectral features like spectral cleaving. This phenomenon may help explain the intermittent shapes commonly observed in type II bursts. Future studies using high-resolution radio telescopes like URAN-2, UTR-2, GURT, NenuFAR, and LOFAR are essential to deepen our understanding of this process.
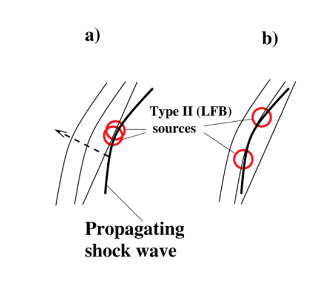
Figure 3. Sketch demonstrating the possible scenario of the occurrence of the spectral cleaving in the Type II (LFB) step by step: a) Phase before the cleaving (~ 13:09:30 UT). b) Phase after the cleaving (~13:10:00 UT).
Based on a recently published article: A. Koval, M. Karlický, A. Brazhenko, A. Stanislavsky, A. Frantsuzenko, M. Vandas, A. Konovalenko, M. Bárta, I. Bubnov, R. Miteva, and S. Yerin, Spectral cleaving in solar type II radio bursts: Observations and interpretation, Astronomy & Astrophysics, 689, A345 (2024) DOI: 10.1051/0004-6361/202451010
References
Alissandrakis, C. E., & Gary, D. E., 2021, Front. Astron. Space Sci., 7, 77
Bhunia, S., Carley, E. P., Oberoi, D., & Gallagher, P. T., 2023, A&A, 670, A169
Chrysaphi, N., Kontar, E. P., Holman, G. D., & Temmer, M., 2018, ApJ, 868, 79
Holman, G. D., & Pesses, M. E., 1983, ApJ, 267, 837
Koval, A., Karlický, M., Stanislavsky, A. et al., 2021, ApJ, 923, 2
Koval, A., Stanislavsky, A., Karlický, M. et al., 2023, ApJ, 952, 1
Vršnak, B., Magdalenić, J., Aurass, H., & Mann, G., 2002, A&A, 396, 673







Leave a Comment