- PlanB has predicted that Bitcoin could touch an average price of $500,000 in 2024-28 cycle.
- PlanB said that the current market crash was a result of the Bybit hack.
- Bitcoin needs to break above $93,000 and reclaim $100K to confirm new all-time highs.
Bitcoin (BTC) is currently in an uncertain phase. Recent price action has sparked debates on whether the market will continue its bullish trajectory or enter a distribution phase leading to a bearish cycle.
In the past 24 hours, the altcoin has dropped 9.94% and trades at $83,137.49 at the time of writing, CoinMarketCap data shows.
Bitcoin Price Drop Sparks Market Uncertainty
With BTC dropping to $83,000 from its January peak of $102,000, many traders and analysts are closely monitoring key technical indicators along with support and resistance levels.
Interestingly, analyst PlanB, the creator of the Stock-to-Flow (S2F) model, predicts BTC will hit an average price of $500,000 during the 2024-2028 halving cycle. He also suggests a possible range of $250,000 to $1 million.
Related: Trump’s Crypto Reserve vs. US Data: Will This Week’s News Drive Bitcoin?
PlanB Cites Bybit Hack as Market Spook
In a YouTube video, PlanB explained this decline was primarily due to the $1.4 billion Bybit Ethereum hack.
While Bitcoin remains highly volatile even in bull markets, he had expected new all-time highs rather than a significant dip. He now sees the market at a crossroads—either continuing its bull run or entering a distribution phase that leads to a bearish cycle.
Related: China Mulls Strategic Bitcoin Reserve? Policy Shift Speculation Shakes Crypto Market
Technical Indicators Still Point to Uptrend
He highlighted key technical indicators. He noted that the RSI fell from 76 to 63 but remains above 50, indicating that the market is still in an uptrend.
However, it appears traditional finance investors, who are now more involved in Bitcoin ETFs, seem hesitant to push RSI beyond 70-75. They tend to sell when the asset appears overbought.
Fibonacci Analysis Suggests Higher Price Targets
A Fibonacci extension analysis offers further understanding of Bitcoin’s potential price trajectory. Based on the daily chart below, the key levels are: 1.618 Extension ($105,218), 2.618 Extension ($112,559) 3.618 Extension ($119,900), and 4.236 Extension ($124,436).
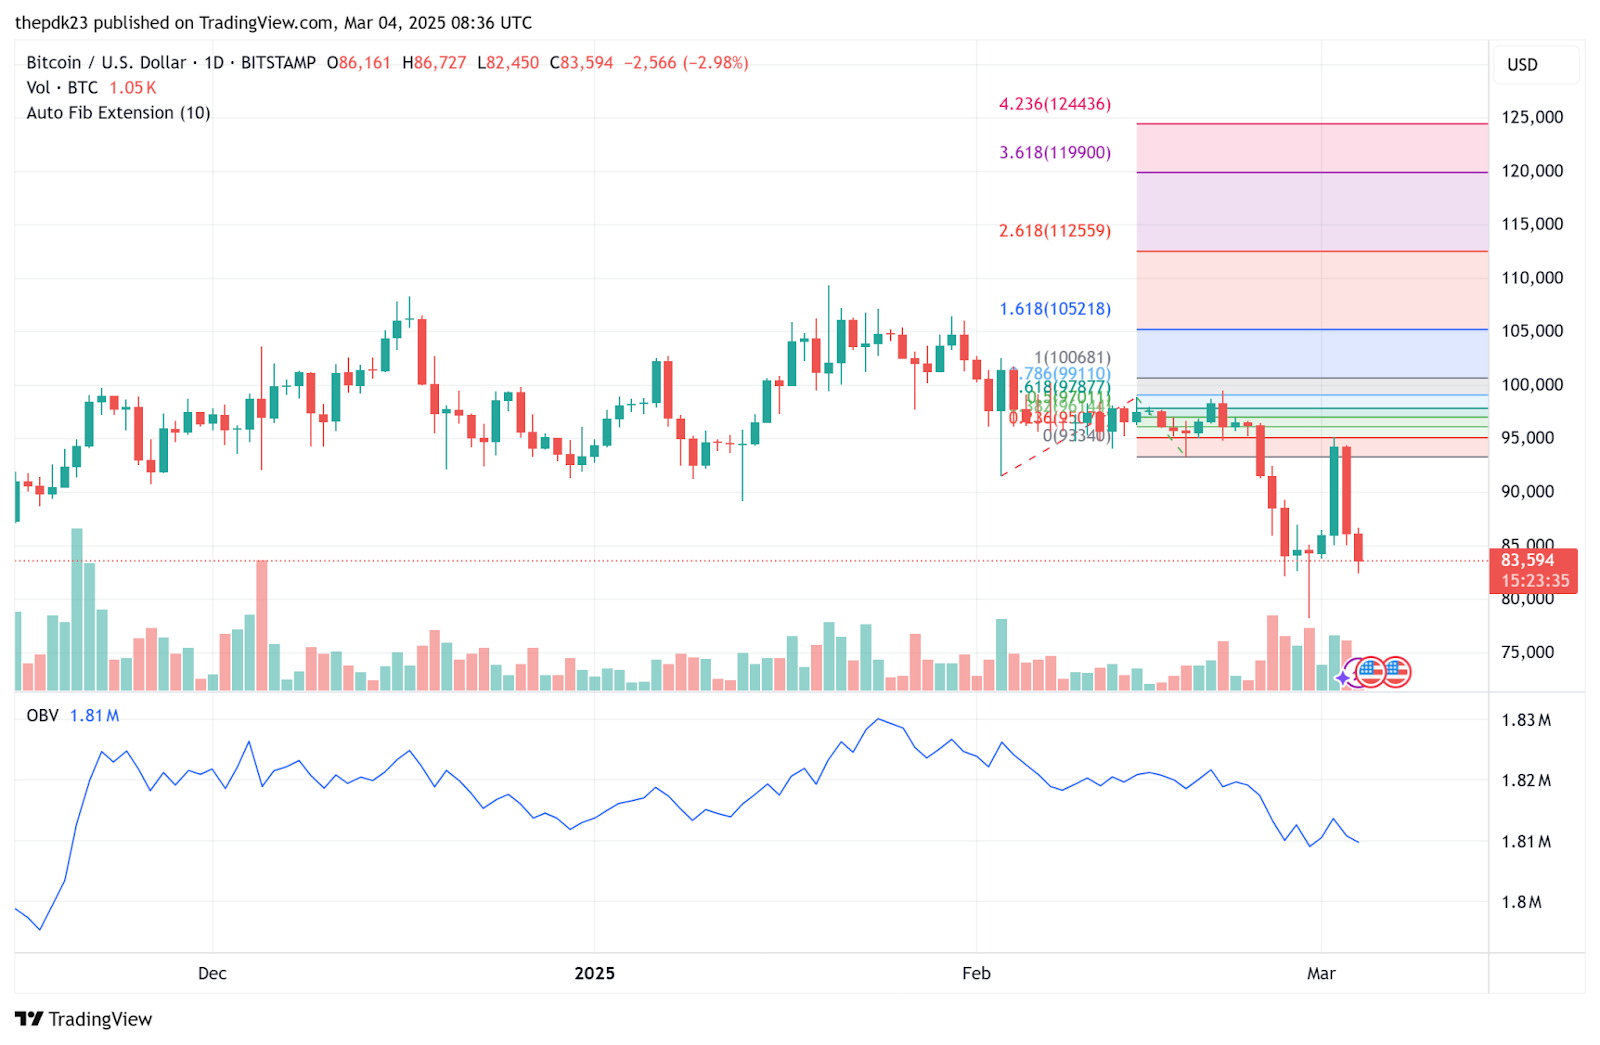

Key Levels for Bitcoin Bullish Reversal
For a renewed bullish trend, BTC must reclaim the $93,000 level. This level has acted as recent resistance. Breaking above this could lead to a move toward $100,000, matching the 1.618 Fibonacci extension.
However, failure to hold current levels might result in a drop to the 2-year realized price of $74,000. This level historically acts as a strong support floor.
Meanwhile, the On-Balance Volume (OBV) indicates a significant drop in inflow for Bitcoin (BTC). This suggests that investors are being cautious.
Disclaimer: The information presented in this article is for informational and educational purposes only. The article does not constitute financial advice or advice of any kind. Coin Edition is not responsible for any losses incurred as a result of the utilization of content, products, or services mentioned. Readers are advised to exercise caution before taking any action related to the company.
Source: https://coinedition.com/bitcoins-next-move-price-analysis-and-market-outlook-for-march-5th/


Leave a Comment